# 🏃♂️ Jogging Dashboard
Interactive Python Dash app to visualize, analyze, and explore your jogging or running sessions recorded as GPX/FIT files.
SVG-Export:
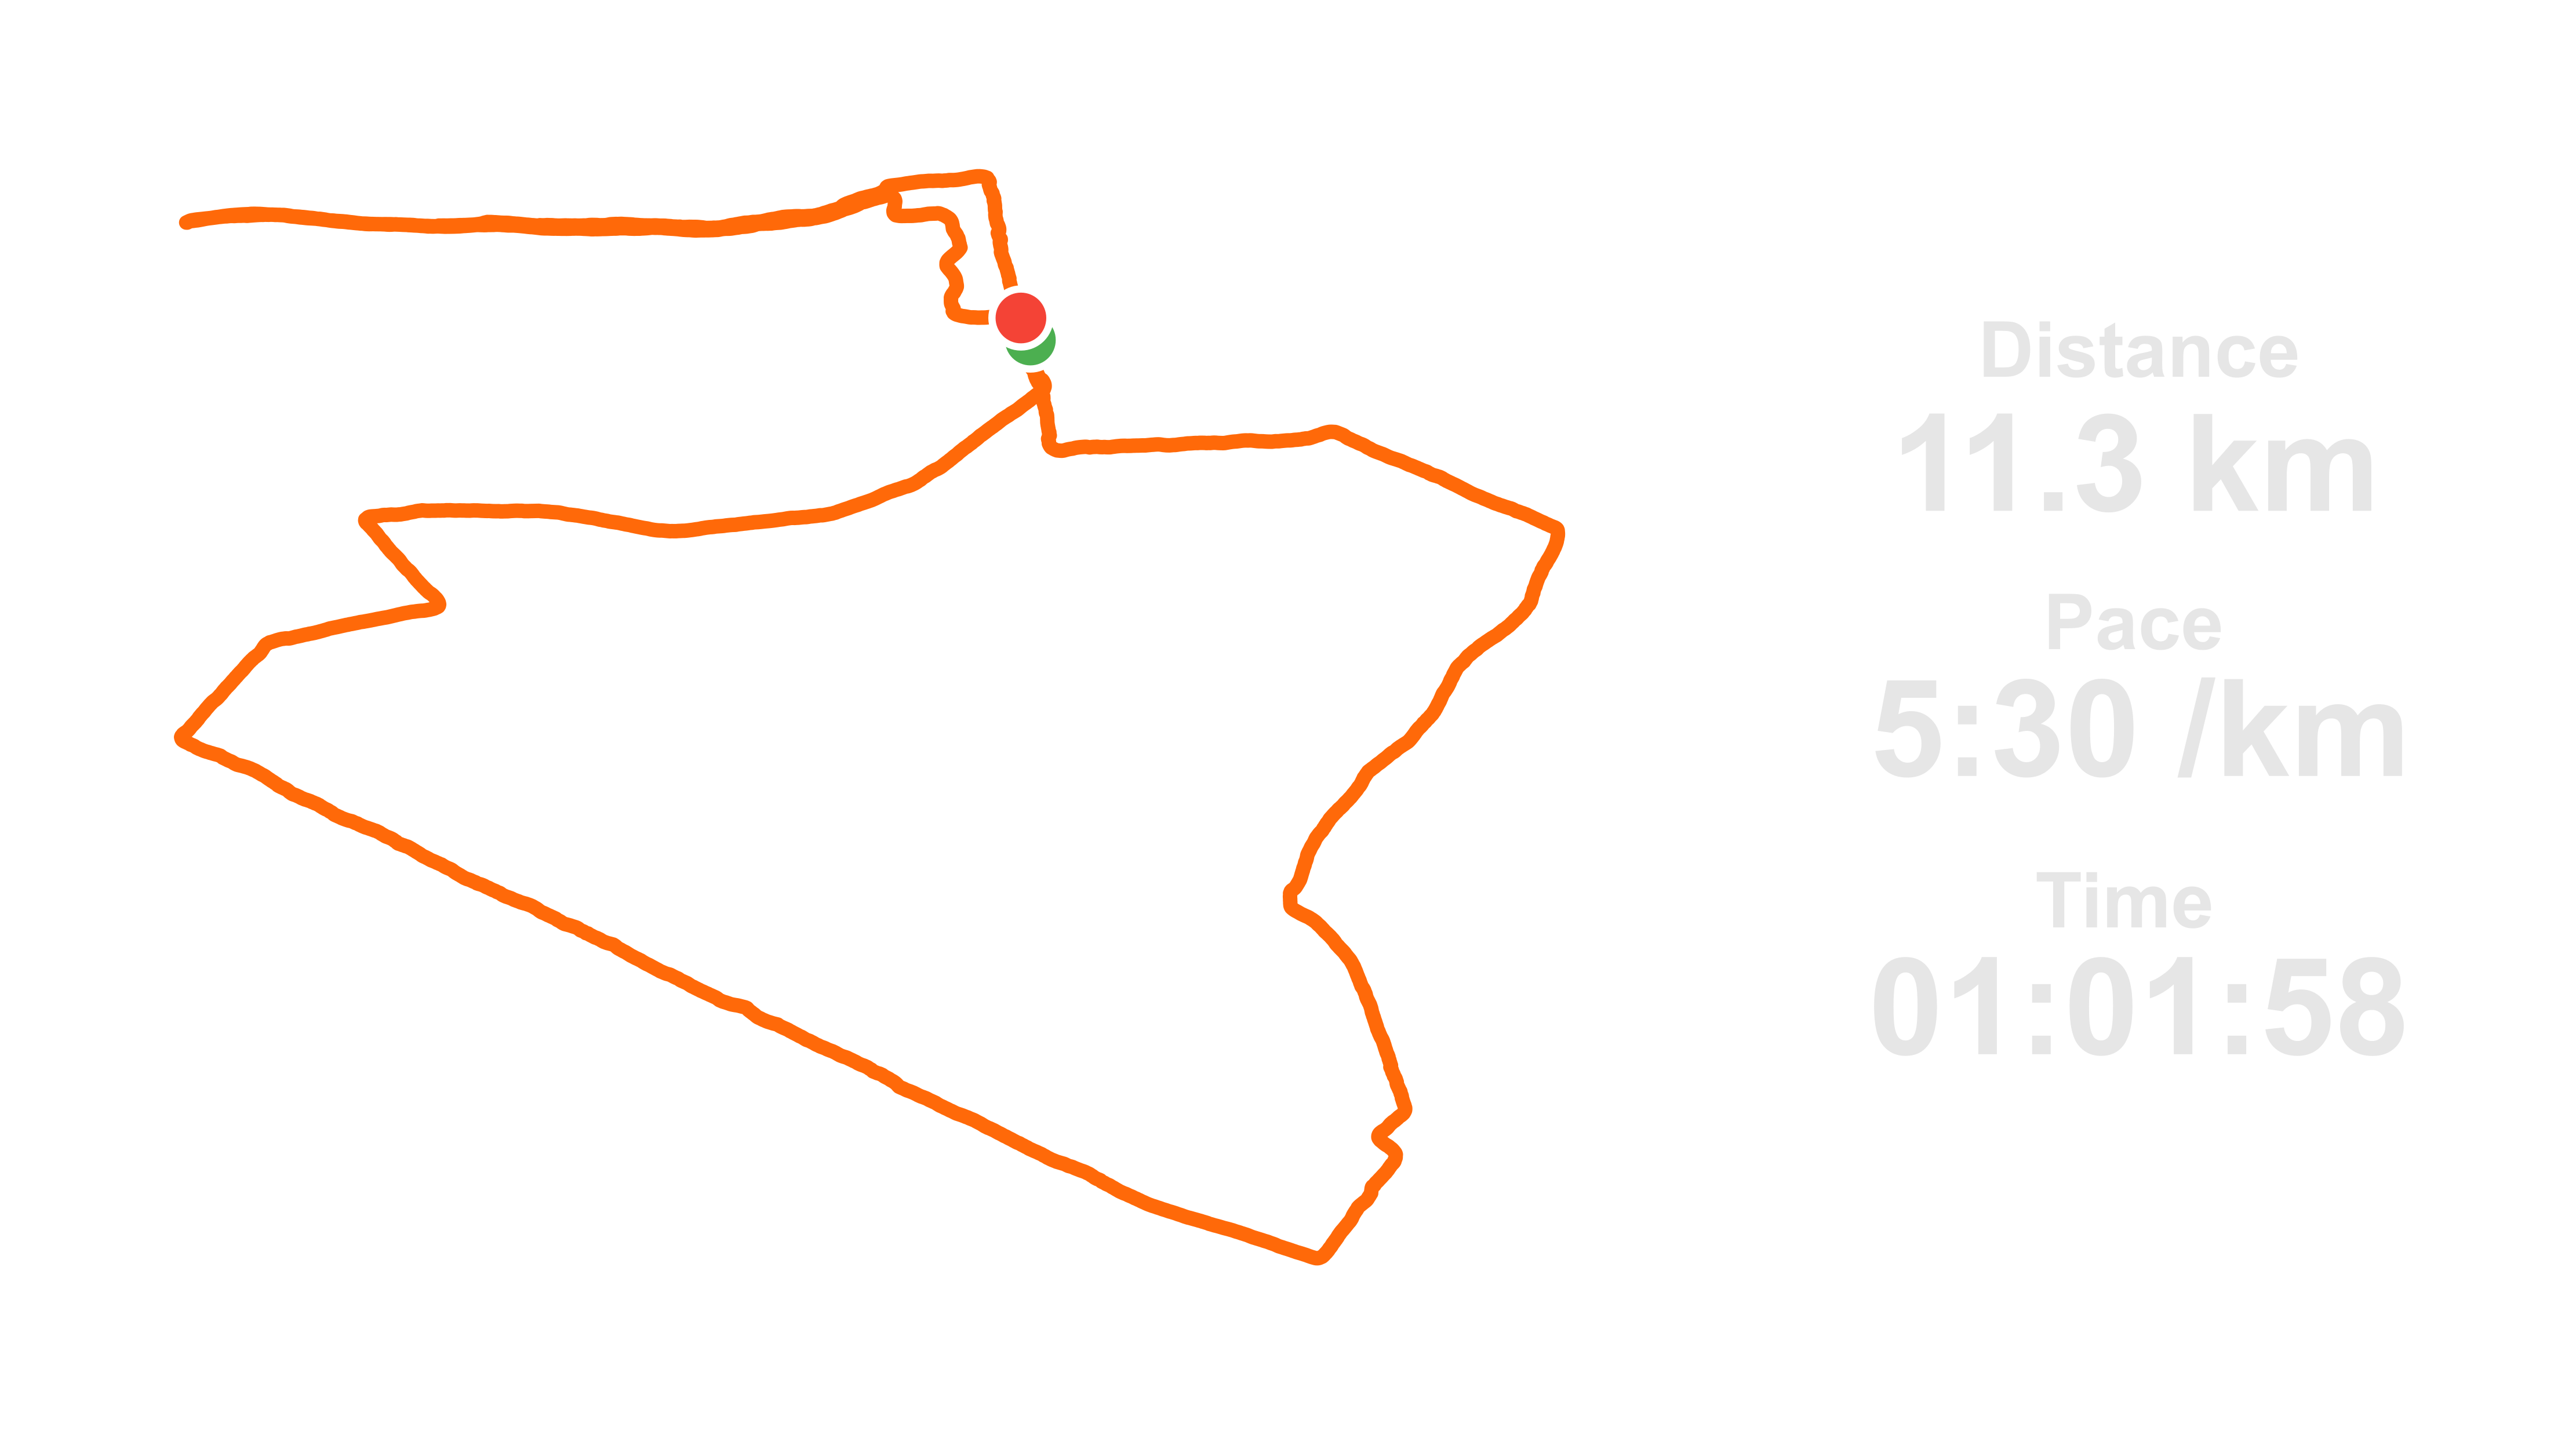
This SVG can then be overlaid on another image (Strava‑inspired).
---
## Features
### 📊 Info & Navigation
- **Select file** — choose any `.gpx` or `.fit` file from the dropdown to analyze your run
- **Export SVG** — creates a transparent SVG overlay of your route and stats (Strava‑inspired)
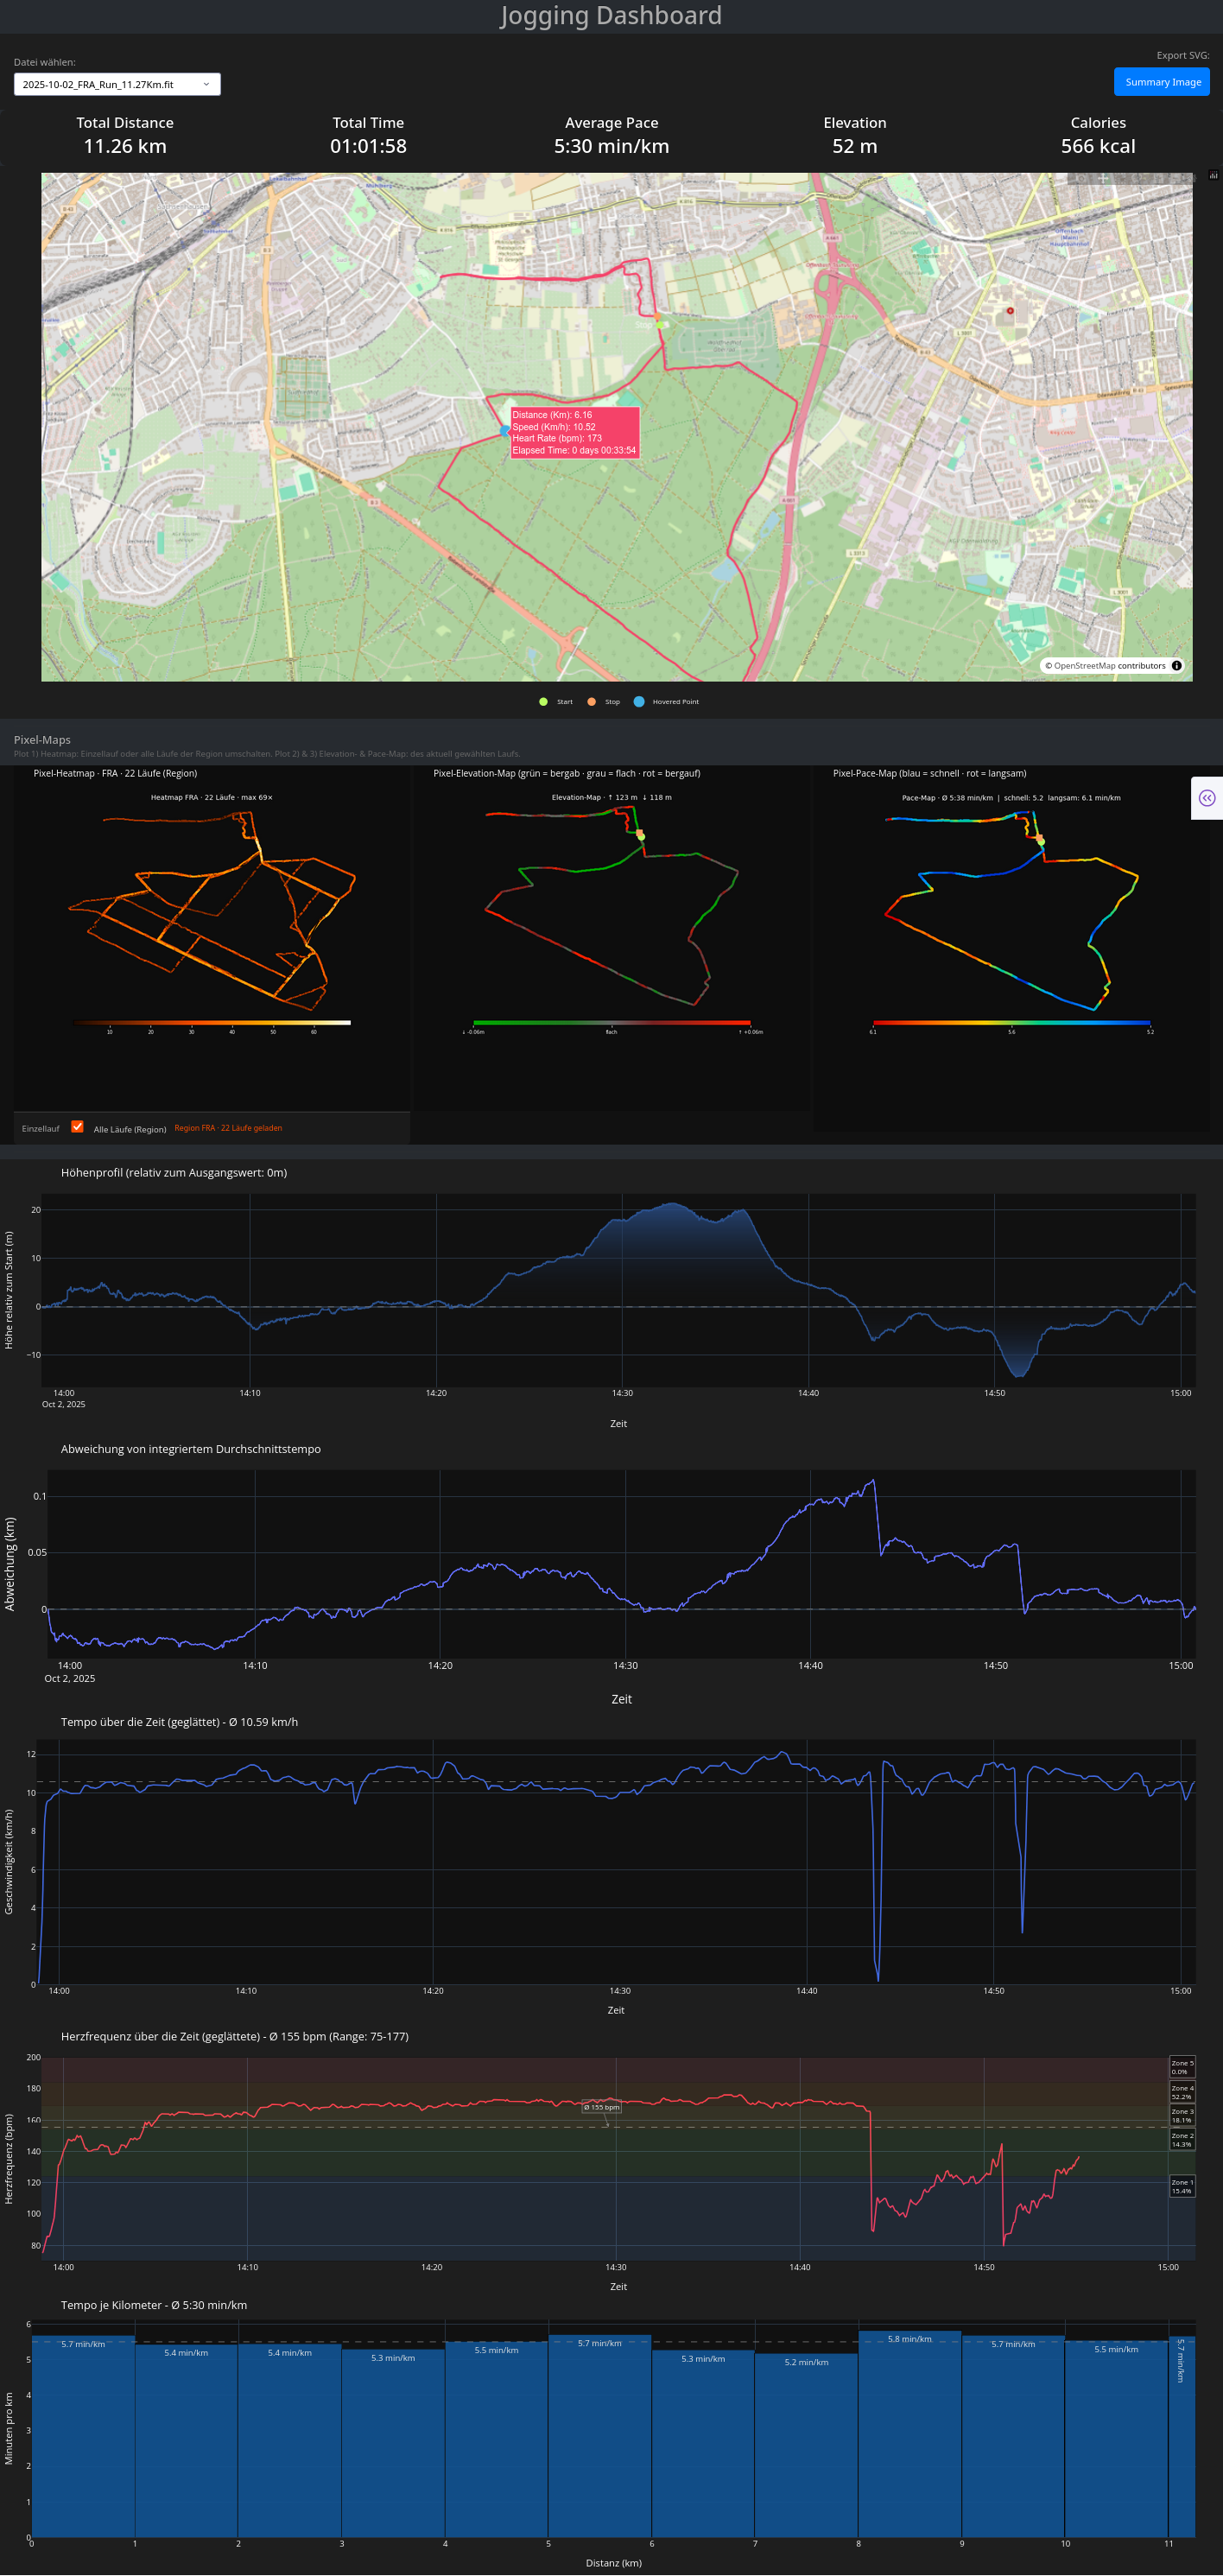
- **Info Banner** — total distance, duration, average pace, elevation gain, and estimated calories burned
### 🗺️ Map & Standard Plots
- **Interactive Map View** — route trace with start/stop markers and hover interaction linked to the elevation profile
- **Elevation Profile** — relative height over time, color-coded per segment: red = climbing, grey = flat, green = descending
- **Speed Over Time** — smoothed speed curve with average reference line
- **Heart Rate Over Time** — smoothed HR curve with zone overlays and percentage breakdown (`.fit` files only)
- **Deviation from Mean Speed** — pacing consistency over the run
- **Pace Bar Chart** — per-kilometer pace breakdown with average reference line
### 🔥 Pixel Maps (Sam-Style)
Three additional pixel-accurate route maps rendered below the main map, inspired by [Sam's approach](https://youtu.be/PA8d4u5T4BM?t=240) of drawing GPS routes pixel by pixel:
- **Heatmap** — draws the route pixelwise and counts how often each pixel was crossed. Segments you run frequently glow brighter (dark → orange → white). Supports two modes toggled via a switch below the plot:
- *Single run* — shows only the currently selected run, but the color intensity is still derived from the full regional count grid so you can see how often you have been at each spot across all your runs
- *All runs (Region)* — overlays all runs from the same city/region (detected automatically from the filename, e.g. `2025-07-30_FRA_Run_6.68Km.fit` → region `FRA`). This is the default view.
- **Elevation Map** — the route is color-coded segment by segment based on the gradient between consecutive GPS points: red = climbing, grey = flat, green = descending. Intensity scales with steepness. GPS noise is removed via smoothing before the gradient is calculated, giving accurate up/down statistics in the title.
- **Pace Map** — each segment is colored by your running pace at that location: blue = fast, red = slow. A horizontal colorbar below the plot shows the pace scale. Outliers (stops, GPS jumps) are filtered automatically.
#### City/Region detection from filename
The heatmap automatically groups runs by city code extracted from the filename at position `[1]` after splitting by `_`:
```
2025-07-30_FRA_Run_6.68Km.fit → region: FRA (Frankfurt)
2025-09-10_HH_Run_10.27Km.fit → region: HH (Hamburg)
```
Use any consistent 2–6 letter code in your filenames to group runs by region.
---
## Project Structure
```
jogging_dashboard_browser_app.py # Main Dash application (Web-Version)
jogging_dashboard_gui_app.py # Main Dash application (loading Web-Version in a GUI)
gpx_files/ # Folder for storing GPX files
fit_files/ # Folder for storing FIT files
requirements.txt # Required Python packages
README.md # Project description file
```
---
## Getting Started
### 1. Clone the repository
```bash
git clone https://github.com/yourusername/jogging-dashboard.git
cd jogging-dashboard
```
### 2. Install dependencies
It is recommended to use a virtual environment:
```bash
python -m venv venv
source venv/bin/activate # On Windows: venv\Scripts\activate
pip install -r requirements.txt
```
**Content of the `requirements.txt` file:**
```
# Dash & Web Components
dash
dash-bootstrap-components
plotly
pandas
numpy
scipy
gpxpy
fitparse
matplotlib
# GUI Version (PyQt6)
PyQt6
PyQt6-WebEngine
# Additional (usually installed automatically)
requests
```
> **Note:** `matplotlib` is required for the Pixel Maps feature and must be added to your `requirements.txt` if not already present.
### 3. Run the app
```bash
python jogging_dashboard_browser_app.py
```
Then open your browser and go to:
[http://127.0.0.1:8051](http://127.0.0.1:8051)
Or as GUI-Version:
```bash
python jogging_dashboard_gui_app.py
```
---
## Uploading Your Activity File
1. Export your activity (e.g., from Strava, Garmin, etc.) as a `.gpx` or `.fit` file
2. Use the recommended filename format for region grouping in the Heatmap:
```
YYYY-MM-DD_CITYCODE_Run_DISTANCEKm.fit
e.g. 2025-07-30_FRA_Run_6.68Km.fit
```
3. Place the file into the `gpx_files/` or `fit_files/` directory
4. Select it via the dropdown in the dashboard
---
## Tech Stack
- **Dash** (by Plotly) — UI framework and interactive graphs
- **Pandas** — data wrangling and processing
- **Plotly Graph Objects & Express** — advanced interactive visuals
- **Scipy** — smoothing the data lines
- **Matplotlib** — pixel-accurate route rendering for the three Pixel Maps
- **GPXPy** — parsing `.gpx` files
- **NumPy** — vectorized math and smoothing
- **FitParse** — parsing `.fit` files
---
## Example File
You can test the dashboard by placing any valid `.gpx` or `.fit` file in the respective directory.
Make sure it contains track points with time, GPS coordinates, and ideally elevation data.
For full Pixel Map functionality (especially the Heatmap region view), use the filename convention:
```
YYYY-MM-DD_CITYCODE_Run_DISTANCEKm.fit
```
---
## To Do / Ideas
- [X] Plotting heart rate data — if `.fit` file chosen
- [X] Pixel Heatmap — frequency map across multiple runs per region
- [X] Pixel Elevation Map — per-segment gradient coloring on the route
- [X] Pixel Pace Map — per-segment pace coloring on the route
- [X] Elevation gain calculation calibrated against Strava
- [X] Calories burned estimation via HR-based Karvonen formula
- [X] GPX file support in addition to FIT
- [ ] Export as PDF report
- [ ] Multi-run comparison overlay
---
## License
This project is open source under the [MIT License](LICENSE).
---
## Feedback / Contributions
Feel free to open issues or pull requests!
If you enjoy this project, a ⭐️ star is always appreciated.