# 🏃♂️ Jogging Dashboard
Interactive Python Dash app to visualize, analyze, and explore your jogging or running sessions recorded as GPX/FIT files.
SVG-Export:
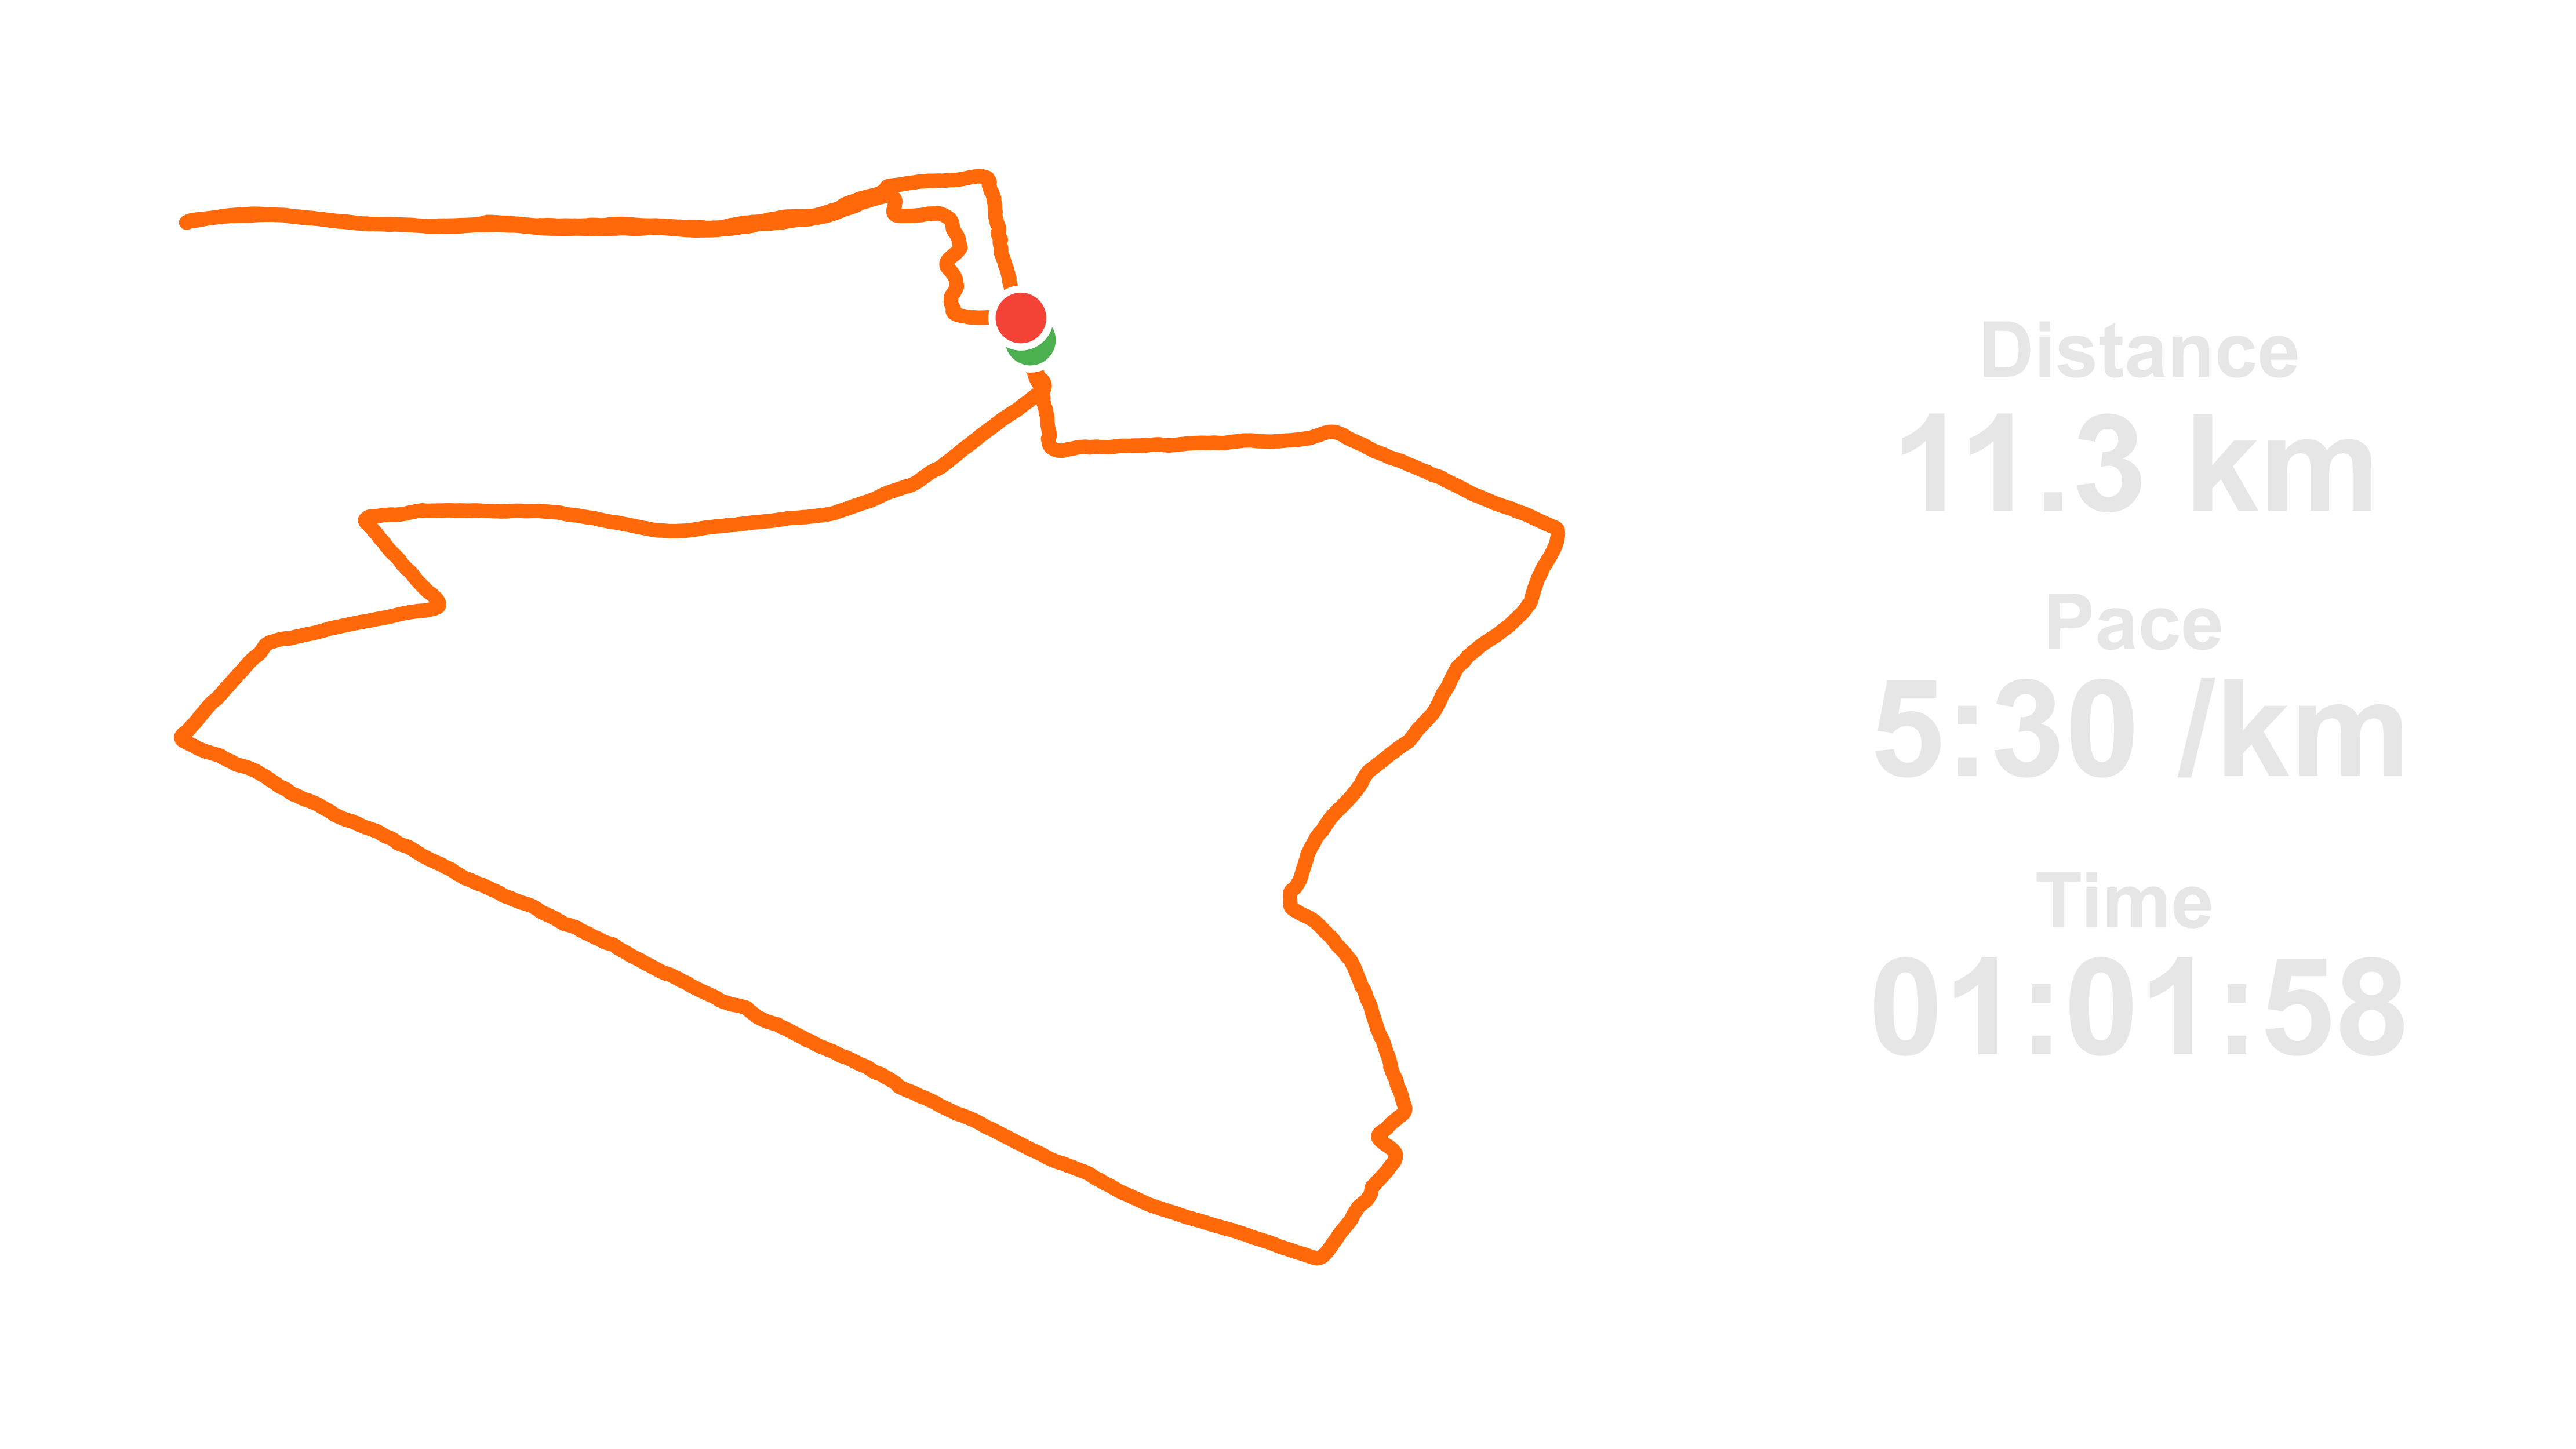
This SVG can then be overlaid on another image (Strava‑inspired).
---
## Features
- **Select file** choose a data file to analyse your run
- **export SVG** creates a transparent SVG image of your Course and the Info Banner statistics (Strava‑inspired)
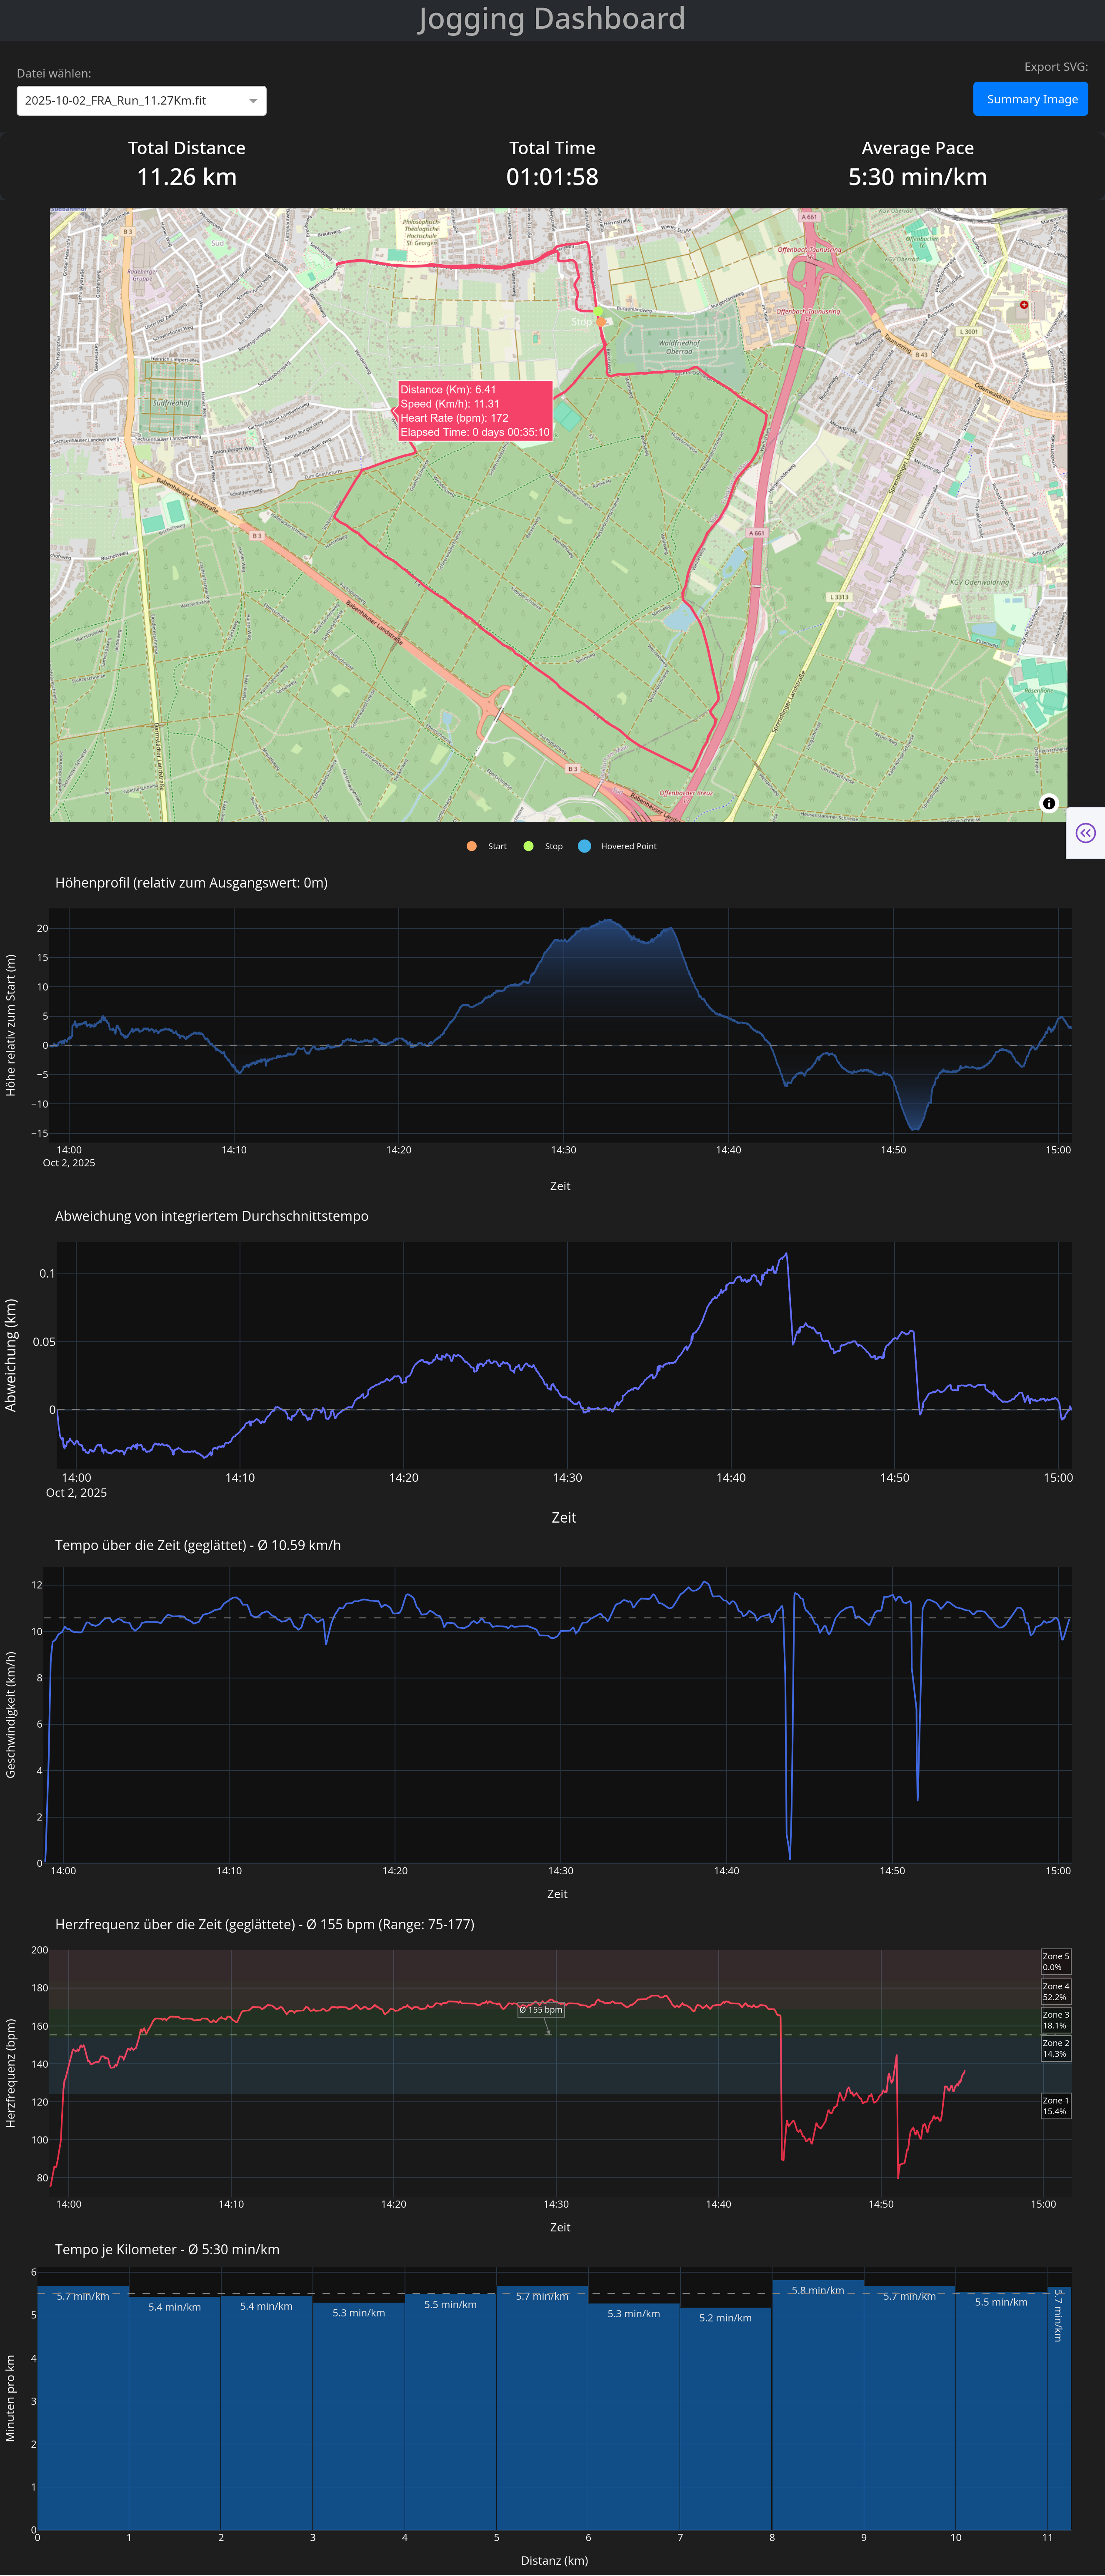
- **Info Banner** with total distance, duration, and average pace
- **Interactive Map View** with route trace and start/stop markers
- **Elevation Profile** with relative height and gradient fill
- **Speed Over Time** plot with smoothing and average line
- **Heart Rate Over Time** plot with smoothing and average line (if .fit file)
- **Deviation from Mean Speed** to see pacing consistency
- **Pace Bar Chart** showing per-kilometer pace breakdown
---
## Project Structure
```
jogging_dashboard_browser_app.py # Main Dash application (Web-Version)
jogging_dashboard_gui_app.py # Main Dash application (loading Web-Version in a Gui)
gpx_files/ # Folder for storing GPX files
fit_files/ # Folder for storing FIT files
requirements.txt # Required Python packages
README.md # Project description file
```
---
## Getting Started
### 1. Clone the repository
```bash
git clone https://github.com/yourusername/jogging-dashboard.git
cd jogging-dashboard
```
### 2. Install dependencies
It is recommend using a virtual environment:
```bash
python -m venv venv
source venv/bin/activate # On Windows: venv\Scripts\activate
pip install -r requirements.txt
```
**Content of the requirements.txt file**:
[Dash & Web Components]
- dash
- dash-bootstrap-components
- plotly
- pandas
- numpy
- scipy
- gpxpy
- fitparse
[GUI Version (PyQt6)]
- PyQt6
- PyQt6-WebEngine
[Additional Dependencies (usually automatically installed)]
- requests
### 3. Run the app
```bash
python jogging_dashboard_browser_app.py
```
Then open your browser and go to:
[http://127.0.0.1:8051](http://127.0.0.1:8051)
Or as Gui-Version
```bash
python jogging_dashboard_gui_app.py
```
---
## Uploading Your GPX File
1. Export your activity (e.g., from Strava, Garmin, etc.) as a `.gpx` or `.fit` file
2. Place the file into the `gpx_files/` or `fit_files/` directory
3. Select it via the dropdown in the dashboard
---
## Tech Stack
- **Dash** (by Plotly) for building the UI and graphs
- **Pandas** for data wrangling
- **Plotly Graph Objects & Express** for advanced visuals
- **Scipy** for smoothing the data lines
- **GPXPy** for parsing `.gpx` files
- **Numpy** for vectorized math and smoothing
- **FitParse** for parsing `.fit` files
---
## Example GPX File
You can test the dashboard by either placing any valid `.gpx` file in the `gpx_files/` or any valid `.fit` file in the `fit_files/` directory.
Make sure it contains track points with elevation and time data.
---
## To Do / Ideas
- [X] Plotting heart rate data - **if** FIT file choosen.
- [ ] Export as PDF report
- [ ] Multi-run comparison
---
## License
This project is open source under the [MIT License](LICENSE).
---
## Feedback / Contributions
Feel free to open issues or pull requests!
If you enjoy this project, a ⭐️ star is always appreciated.